📊 GA4 Dashboards Publish to Everyone on the Property: What the 15-Card Canvas Shows, What It Can't, and Where Data Studio or BigQuery Still Wins
GA4's new Dashboards are shared with everyone on the property, cap at 15 cards and skip segments and the API. What to publish, and what to keep elsewhere.
🚀 THE EXECUTIVE SUMMARY
The Definition: On 9 September Google added Dashboards to Google Analytics: a grid canvas under Reports where you drag dimensions and metrics onto cards and publish the page to the left navigation. Google's release note calls them "a highly flexible way to help businesses view their KPIs on a single report." A standard property gets up to 15 cards per dashboard; an Analytics 360 property gets 30.
The Core Insight: The canvas is the easy part. The limitations section decides what belongs on it. "All published dashboards are shared with the property", so Publish is an access decision, not a layout one. There are no segments and no API, and a dashboard sits in Reports, whose numbers Google says can differ from your BigQuery export. Publish the KPIs everyone on the property may see. Keep restricted figures and anything someone will reconcile somewhere else.
What shipped, in Google's words
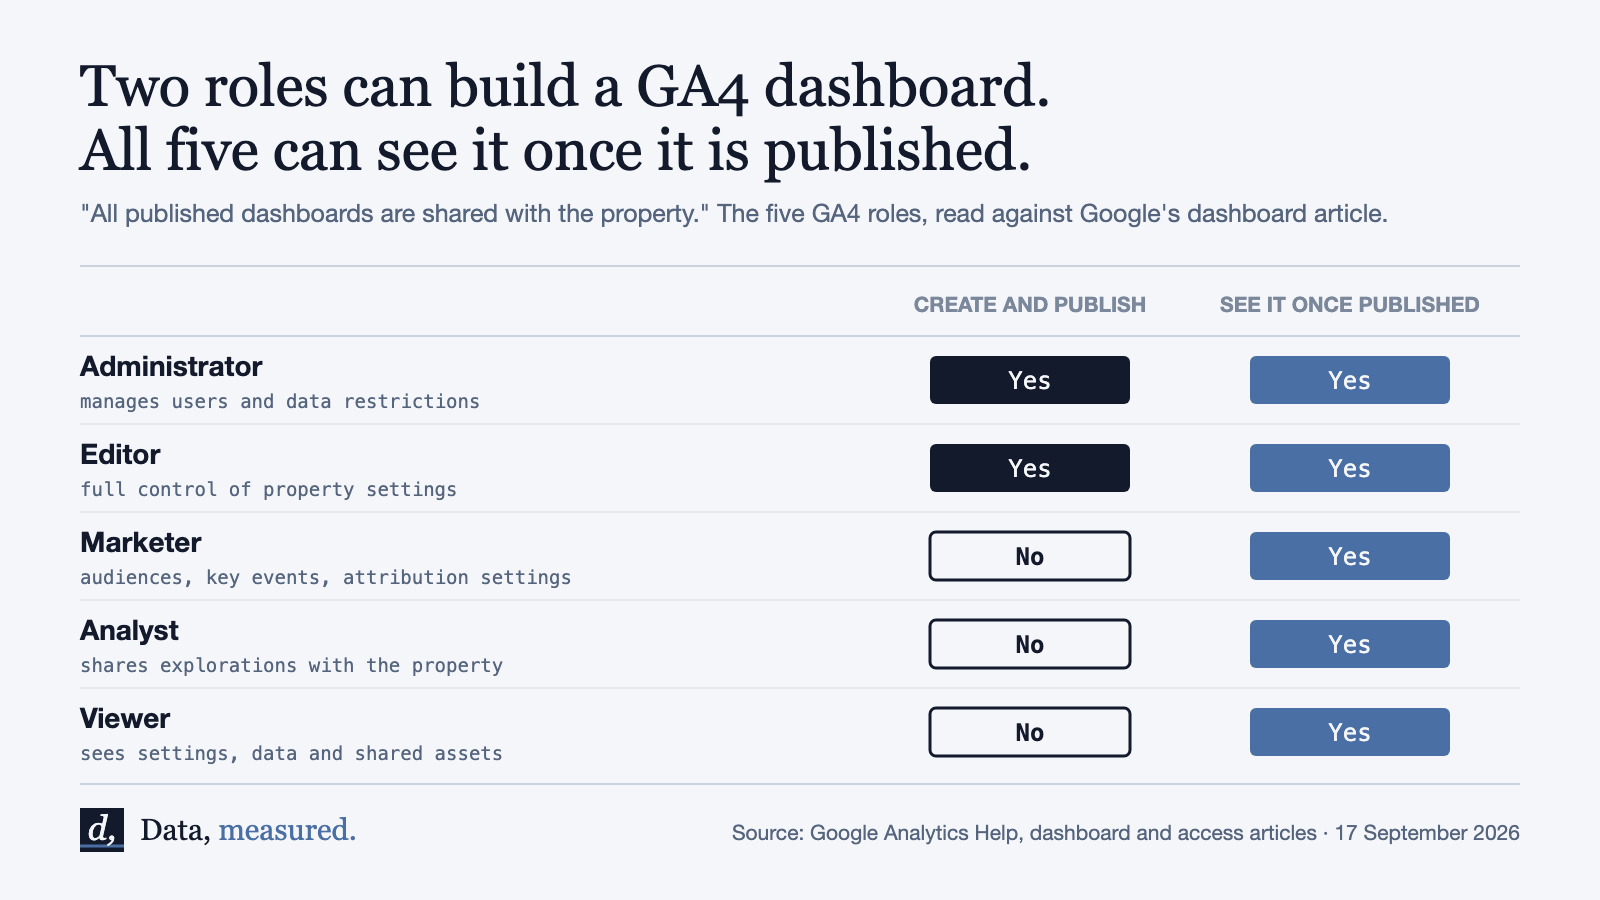
The dashboard help article lists six visualisations: scorecards (with a percentage change when a date comparison is applied), tables, line charts at daily, weekly or monthly grain, bar charts, donut charts and funnel charts. Creating and publishing needs the Editor or Administrator role, and a dashboard can go straight to the left navigation "without having to go through the library".
The limits section adds that "API support, segments, and card-level comparisons are currently not supported." The feature is still reaching properties; Loves Data notes you may have it in one property and not another. Look for a Create button at the top of the Reports navigation.
The compliance angle: Publish shares with everyone who has access
Google's article is plain: "anyone with access to the property can view dashboards that have been published." Its access article says the lowest role, Viewer, "can see shared assets via the user interface or the APIs". On most properties that includes an agency, an old contractor and people who have changed teams.
GDPR Article 25(2) makes accessibility part of data protection by default: the obligation to process only necessary personal data "applies to the amount of personal data collected, the extent of their processing, the period of their storage and their accessibility." GA4 is not supposed to hold personal data at all, but Google's own PII guidance warns that "PII is often inadvertently sent in these URLs and titles." A table card on Page location, query strings included, is where an email address in a password-reset URL becomes visible to every account on the property.
Revenue is the commercial version. GA4's No Cost Metrics and No Revenue Metrics restrictions are listed as applying in "reports, explorations, audiences, insights, and alerts". The dashboard article does not mention them. The first time you publish revenue or ROAS cards, open the dashboard from a restricted account within the hour.
Dashboards, Data Studio or the warehouse
| Setup | What the numbers are | Who sees it | Segments | What you give up |
|---|---|---|---|---|
| GA4 Dashboards | Reports data: modeled users, (other) rows possible | Everyone with property access, once published | Not supported | 15 cards (30 on 360), six chart types, no API |
| Data Studio on the GA4 connector | Data API: matches reports, not explorations | People you invite; on owner's credentials, they need no GA4 access | Not available in the connector | Data API quotas; one more tool to govern |
| BigQuery export with your own BI | Event-level rows: no behavioral modeling, no (other) row | Whoever your warehouse grants | Yours, in SQL | Engineering time; 1M events a day on standard properties |
Segments are the row teams get wrong. Data Studio (Google renamed Looker Studio back in April) says of its GA4 connector that "Google Analytics 4 segments and comparisons are not available", so moving there does not buy you segments; explorations and BigQuery do. What Data Studio does buy is a narrower audience: you invite specific people or Google Groups to each report. The catch runs the other way. Owner's credentials "let other people view or create reports that use this data without requiring them to have their own access to the dataset", so a Data Studio report can reach people who were never on the property.
Our read: GA4 Dashboards for the weekly KPI page the whole property already sees, Data Studio when the audience should be smaller or larger than the property, BigQuery when someone will reconcile the number.
The Expert Perspective
A dashboard lives in Reports, and Google's reporting surfaces comparison spells out what Reports carry. They include behavioral modeling for consent mode; BigQuery does not, and Google's own example of the gap is "fewer active users in reports than BigQuery". Reports can also condense rows into (other) when a table passes its row limit, which BigQuery never does. The dashboard article links Google's cardinality page, where a dimension with more than 500 unique values in a day counts as high cardinality, and Page path, Page location and Item ID are the named examples. A table card on one of those is where (other) turns up. An Active users scorecard that disagrees with your warehouse is not a bug to file; name what the card counts in its title.
Two limits are quieter. With no API, a dashboard cannot be exported or rebuilt by script, so keep a one-line spec per card (metric, dimensions, date range) next to your tracking plan. And a ROAS card is only as right as the cost behind it. If you import Meta or TikTok spend, run the validation report from our issue on GA4's imported-cost checks before that card goes live. The launch is on this change on the log, with the pre-publish checks as the artifact, verified 17 September 2026.
Conclusion & Next Steps
- Open Property access management and remove anyone who should not see a KPI page, before the first dashboard is published.
- Keep Page location, query strings and free-text custom dimensions off published table cards, and turn on data redaction for email addresses and the query parameters you know carry personal data.
- Spend the 15 cards on numbers the whole property may see. Client splits, margin and board figures go in a report you share by name.
- Title each card with what it counts, and keep the card specs outside GA4.
FAQ
Can I keep a GA4 dashboard private? Not once it is published. Google's article says all published dashboards are shared with the property and describes no per-dashboard access list. For a narrower audience, build the page in Data Studio and invite people to the report.
Why doesn't my dashboard match BigQuery? Reports can include behavioral modeling for consent mode and can condense long-tail rows into (other). The BigQuery export holds event-level rows with neither, so user counts and long tables differ by design.
Why can't I see the Dashboard option? Either the feature has not reached your property yet, or your role is below Editor. Marketers, Analysts and Viewers see published dashboards but cannot create them.
References & Sources Cited
- Google Analytics Help, What's new in Google Analytics (9 September 2026)
- Google Analytics Help, About Google Analytics dashboard
- Google Analytics Help, Reporting surfaces comparison
- Google Analytics Help, Access and data-restriction management
- Google Analytics Help, Best practices to avoid sending PII
- Google Cloud, Data Studio: Connect to Google Analytics
- Google Cloud Blog, Looker Studio is Data Studio (11 April 2026)
- GDPR Article 25, Data protection by design and by default
- PPC Land, Google Analytics gains drag-and-drop dashboards limited to 15 cards
- Loves Data, New Google Analytics Dashboards
Forwarded this by a friend? Subscribe here. Found it useful? Forward it to one person who'd want it.
See you soon, Team Data Measured